Measure Memory Allocation Cost, by Eliminating It
Over the years, I've learnt to be suspicious of any dynamic allocation in performance critical code, and moving allocations back up the call stack can often yield significant speedups.
But I'm guilty of being a little religious about this, on some occasions, and this hasn't always been for the best.
Dynamic allocation helps a lot with writing flexible and robust code. Changing code to remove dynamic allocations can make the code more complicated, brittle, and harder to maintain, and sometimes generalised memory allocation is really just the best tool for the job.
The first rule of optimisation is to measure. In this post I show how to measure when and where dynamic allocation is actually a significant overhead (and a worthwhile optimisation target), in a simple platform independent way.
(Sample code is in C++ but the core idea is straightforward and can be applied in other languages.)
Sampling profilers
It's a great feeling to have an effective measurements-based optimisation process in place. And the simpler and more direct the measurement, the better.
Something that worked well for me in the past was (sampling) profiler driven optimisation. I remember using sampling profilers pretty much exclusively back in the day, working on PC only games, when VTune was the big thing.
I'd run VTune with some kind of typical (or target) workload, see which functions came up at the top of the profile, look at those functions carefully, hopefully see some way to speed them up significantly, rinse and repeat.
Sometimes I'd see a bunch of memory allocation stuff scattered around the top of the profile, and understand that I needed to look at reducing the amount of dynamic memory allocation.
Getting cloudy
That kind of did the job, but didn't give me a very clear measure of the actual time spent in allocation. The stuff I'm working on now is perhaps more complicated. And things have changed a lot since those days, making sampling profilers less useful.
CPUs architectures are a lot more involved and there's a load more caching and stuff in between individual instructions and actual execution times, which further clouds our view of what time is spent doing what. To really understand what's going on these days you often need to pull out some event based profiling.
But while that can be kind of fun, it's not always easy to relate processor event counts to actual code. Having a bunch of measurements to look at is more work then a single direct measure. What I need is a quick and easy measure that shows me directly where in the code I need to focus my attention, without having to think too hard or do too much detective work.
Hidden costs
To make things more fun, behind the scene details of operating systems memory management can result in significant additional hidden costs.
So memory might get paged-in on first access through a page fault handler, or zero initialisation on demand, for example. (See this post by Bruce Dawson.)
Trying to measure all this stuff effectively, across multiple platforms, is seems like a lot of work, but fortunately we can take a different approach, and side-step a bunch of these details.
What to measure?
Let's try defining what we actually want to measure.
A straightforward definition, given some benchmark, might be that we want to measure 'the time spent in memory allocation' during the benchmark.
But while that sounds reasonable enough, it's clear that stuff like CPU caching and OS memory management make this difficult to measure in practice. How do we account for time spent pulling in new cache lines after cache pollution? And what about time spent paging memory in on first use, outside of actual memory allocation calls?
Instead of trying to build a bunch of complicated stuff to handle these details let's just change the definition slightly, and make things easier for ourselves. So, what we'll choose to measure is 'the extra time taken due to dynamic allocation overhead' when running the benchmark.
Concretely, we're going to measure the difference in execution time between the benchmark running normally (with normal dynamic memory allocation) and the benchmark running with memory allocation costs eliminated.
Allocation costs
Memory allocation is expensive because it involves a bunch of tasks (or problems to solve) and has effects on CPU state.
Tasks include keeping track of the state of allocated memory blocks, a bit of search for a suitable free block to allocate, and zero fill operations.
Effects are due to things like scattered reads while scanning through linked lists in memory heaps (causing cache pollution), and memory writes for updating heaps and zeroing memory (causing cache invalidation).
But we don't actually need to worry about the exact mechanism for these various costs. The point is just that there's a bunch of stuff happening because our application is using dynamic allocation calls. And that we can effectively eliminate these costs in certain situations.
Trivial allocation
To eliminate memory allocation costs, we'll replace these expensive allocation tasks (with a bunch of memory accesses and various secondary effects), with completely trivial operations (with very minimal memory access).
It turns out that we can actually do this pretty easily, if we can make certain assumptions about the code to be benchmarked.
Specifically, we'll assume that this code is deterministic and makes exactly the same sequence of memory allocation requests on each run.
Deterministic code is a good thing. Unless there's some specific reason why your code cannot be deterministic, I think that you should normally aim to write deterministic code. But this also means that we need to limit this technique, in it's simple form, to single threaded benchmarks. (You may be able to do something similar in multithreaded benchmarks, though. I'll come back to this later.)
Anyway, assuming deterministic allocations, we're going to:
- run the benchmark once, with some custom allocators,
- record a sequence of allocation decisions from this first run, to serve as a kind of 'allocation script',
- and then run the benchmark again, with allocations served trivially from this allocation script.
Let's look at some code.
Allocator virtual interface
All dynamic allocation in PathEngine goes through a virtual interface with methods for allocation, deallocation and expanding previously allocated blocks.
We'll ignore the expand functionality for the duration of this post and the code assumes the following virtual interface definition:
// iAllocator.h

#include <stdint.h>

class iAllocator
{
public:
    virtual ~iAllocator() {}
    virtual void* allocate(uint32_t size) = 0;
    virtual void deallocate(void* ptr) = 0;
    // ignored to keep things simple:
    //virtual void* expand(void* oldPtr, uint32_t oldSize, uint32_t oldSize_Used, uint32_t newSize) = 0;
};
This virtual interface is quite similar to the BitSquid allocator, described here, except that there's no alignment parameter, and no access to allocated block size. (Refer to that blog post for some more in depth discussion of this kind of setup, in general.)
Note that we don't use exceptions and the allocation failure case is reported by returning nullptr. Also, allocation sizes are limited to 32 bit, even on 64 bit platforms. (We're going to assume that 32 bits is enough for a bunch of stuff, in fact, when running our benchmarks.)
Implementing our own allocator
The next step is to implement a simple custom allocator, based on this interface. Crucially, the allocator will serve allocation requests out of a single large block, passed in to its constructor.
Here's the class definition:
// FirstFitInHeap.h

#pragma once
#include "iAllocator.h"

class cFirstFitInHeap : public iAllocator
{
    uint32_t* _heap;
    uint32_t _heapSize; // in 32 bit words

// helpers for list prev and next reference accessing
    uint32_t&
    prev(uint32_t block)
    {
        return _heap[block + 0];
    }
    const uint32_t&
    prev(uint32_t block) const
    {
        return _heap[block + 0];
    }
    uint32_t&
    next(uint32_t block)
    {
        return _heap[block + 1];
    }
    uint32_t&
    prevFree(uint32_t block)
    {
        return _heap[block + 2];
    }
    const uint32_t&
    prevFree(uint32_t block) const
    {
        return _heap[block + 2];
    }
    uint32_t&
    nextFree(uint32_t block)
    {
        return _heap[block + 3];
    }
    bool
    isAllocated(uint32_t block) const
    {
        return prevFree(block) == 0xffffffff;
    }
    void
    markAsAllocated(uint32_t block)
    {
        prevFree(block) = 0xffffffff;
    }
    void*
    memFor(uint32_t block)
    {
        return reinterpret_cast<void*>(_heap + block + 3);
    }
    uint32_t
    blockForMem(void* memPtr)
    {
        uint32_t* asWordPtr = reinterpret_cast<uint32_t*>(memPtr);
        uint32_t* blockPtr = asWordPtr - 3;
        return blockPtr - _heap;
    }

    void
    removeFromFreeList(uint32_t block)
    {
        uint32_t before = prevFree(block);
        uint32_t after = nextFree(block);
        nextFree(before) = after;
        prevFree(after) = before;
    }
    void
    addToFreeList(uint32_t block)
    {
        // (note that this can be zero, in case where free list is empty)
        uint32_t prevFirstFree = nextFree(0);
        nextFree(block) = prevFirstFree;
        prevFree(block) = 0;
        nextFree(0) = block;
        prevFree(prevFirstFree) = block;
    }

public:

    cFirstFitInHeap(void* heap, uint32_t heapSize);

    static uint32_t minHeapSize();

// iAllocator

    void* allocate(uint32_t size);
    void deallocate(void* ptr);
};
And here's the corresponding cpp:
// FirstFitInHeap.cpp

#include "FirstFitInHeap.h"
#include <assert.h>
#include <string.h>

static uint32_t
ToWordSize(uint32_t sizeInBytes)
{
    return (sizeInBytes + 3) / 4;
}
// in words, including header info
static uint32_t
MinBlockSize()
{
// must be at least large enough to include header info + some space for data
    return 6;
}
static uint32_t
AllocatedMarker()
{
    return 0xffffffff;
}

cFirstFitInHeap::cFirstFitInHeap(void* heap, uint32_t heapSize)
{
    heapSize /= 4;
    _heap = reinterpret_cast<uint32_t*>(heap);
    _heapSize = heapSize;
    assert(_heapSize >= 4 + MinBlockSize());
// set up sentinel free node
    // (prev doesn't need to be set, since block 0 is known to be first in heap)
    next(0) = 4;
    prevFree(0) = 4;
    nextFree(0) = 4;
// set up initial single useable free node
    prev(4) = 0;
    next(4) = _heapSize;
    prevFree(4) = 0;
    nextFree(4) = 0;
}

uint32_t
cFirstFitInHeap::minHeapSize()
{
    return (4 + MinBlockSize()) * 4;
}

// iAllocator

void*
cFirstFitInHeap::allocate(uint32_t size)
{
    //PROFILER_SCOPE("cFirstFitInHeap::allocate()");
    size = ToWordSize(size) + 3;
    uint32_t candidate = nextFree(0);
    while(candidate != 0)
    {
        uint32_t candidateSize = next(candidate) - candidate;
        if(candidateSize >= size)
        {
        // found first fit
            uint32_t allocated;
            if(candidateSize - size >= MinBlockSize())
            {
            // split to allocated and free blocks
                allocated = candidate + candidateSize - size;
                prev(allocated) = candidate;
                uint32_t after = next(candidate);
                next(allocated) = after;
                if(after != _heapSize)
                {
                    prev(after) = allocated;
                }
                next(candidate) = allocated;
            }
            else
            {
            // (use the whole block)
                removeFromFreeList(candidate);
                allocated = candidate;
            }
            markAsAllocated(allocated);
            return memFor(allocated);
        }
        candidate = nextFree(candidate);
    }
    return 0; // allocation failed
}
void
cFirstFitInHeap::deallocate(void* ptr)
{
    if(ptr == 0)
    {
        return;
    }
    //PROFILER_SCOPE("cFirstFitInHeap::deallocate()");
    uint32_t block = blockForMem(ptr);
    uint32_t after = next(block);
    if(block && !isAllocated(prev(block)))
    {
    // merge with previous block
        uint32_t before = prev(block);
        next(before) = after;
        if(after != _heapSize)
        {
            prev(after) = before;
        }
        // and update the block to be handled by following logic
        block = before;
    }
    else
    {
    // just add to free list, initially
    // (bit inefficient, but means we can share the following logic)
        addToFreeList(block);
    }
    if(after != _heapSize && !isAllocated(after))
    {
    // merge with following block
        uint32_t afterAfter = next(after);
        next(block) = afterAfter;
        if(afterAfter != _heapSize)
        {
            prev(afterAfter) = block;
        }
        removeFromFreeList(after);
    }
}
(Sorry if that's a bit of a mouthful, but don't worry, it's downhill from here.)
I've chosen the first fit algorithm because this is fairly easy to implement and does reasonably well at avoiding fragmentation, but it's not the fastest memory allocation algorithm around. (You can find some benchmarks for different memory allocation algorithms here.)
I didn't go to a lot of effort to optimise this implementation, either, and overall this allocator implementation is just really slow compared to your system allocator, but it's ok, we only actually need this to be fast enough for the initial run of our benchmark to complete in a reasonable time. (Remember that the initial run of our benchmark is just a way for us to solve the 'allocation problem' for the benchmark. We won't normally be timing this run!)
Recording an allocation script
When we run our benchmark with cFirstFitInHeap we know that pointers to allocated blocks all fall in a fixed range (corresponding to the heap and heapSize parameters we passed to the cFirstFitInHeap constructor), and we can convert these pointers to offsets from heap base address.
Storing these offsets (with a bit of additional information) gives us the allocation script, and we'll play this back later on to recreate exactly the same allocation patterns in another 'memory heap' (independent of actual heap location in each case).
Here's a custom allocator class for recording out this allocation script:
// RecordingAllocator.hpp

#pragma once

#include "iAllocator.h"
#include <stdio.h>

class cRecordingAllocator : public iAllocator
{
    iAllocator* _base;
    char* _heapStart;
    FILE* _file;

    uint32_t offsetFor(void* ptr) const;
    void writeU32(uint32_t u);

public:

    // base allocator must stay valid
    // for lifetime of this object
    // but can be invalid on destructor call
    cRecordingAllocator(iAllocator* base, void* heapStart);
    ~cRecordingAllocator();

    void* allocate(uint32_t size);
    void deallocate(void* ptr);
};
// RecordingAllocator.cpp

#include "RecordingAllocator.h"
#include "LowLevelAssert.h"

uint32_t
cRecordingAllocator::offsetFor(void* ptr) const
{
    LowLevelAssert(ptr != nullptr);
    char* cptr = reinterpret_cast<char*>(ptr);
    LowLevelAssert(cptr >= _heapStart);
    return cptr - _heapStart;
}

void
cRecordingAllocator::writeU32(uint32_t u)
{
    if(_file)
    {
        size_t byteSize = sizeof(u);
        size_t written = fwrite(&u, 1, byteSize, _file);
        LowLevelAssert(written == byteSize);
    }
}

cRecordingAllocator::cRecordingAllocator(
        iAllocator* base, void* heapStart
        ) :
 _base(base)
{
    _heapStart = reinterpret_cast<char*>(heapStart);
    _file = fopen("allocationScript.bin", "wb");
    LowLevelAssert(_file != nullptr);
}
cRecordingAllocator::~cRecordingAllocator()
{
    if(_file)
    {
        int error = fclose(_file);
        LowLevelAssert(!error);
    }
}

void*
cRecordingAllocator::allocate(uint32_t size)
{
    LowLevelAssert(size < 0xffffffff);
    writeU32(size);
    void* result = _base->allocate(size);
    writeU32(offsetFor(result));
    return result;
}
void
cRecordingAllocator::deallocate(void* ptr)
{
    if(ptr != nullptr)
    {
        writeU32(0xffffffff);
        writeU32(offsetFor(ptr));
        _base->deallocate(ptr);
    }
}
This is kind of 'old-timer' C++. You could complain about those raw pointers constructor arguments, with implied lifetime constraints, and maybe you'd prefer modern C++ file handling, but, well, take it from an old-timer, there can be good reasons to use this kind of low-level approach when writing instrumentation code.
There's a good chance this class will get used as part of a global allocator, for example, servicing general allocation requests. So we should avoid anything that might trigger additional, nested, allocations (and stack overflow through infinite recursion).
Old-style C file IO calls are used because these are less likely to trigger calls back to a global allocator. I haven't provided a definition for LowLevelAssert(), but this should also avoid allocations as far as possible, perhaps just calling on to printf() and exit(). (It's probably ok for this to just bomb out with a rude message, as long as we know something's gone wrong!)
Chaining with cFirstFitInHeap
Chaining this together with cFirstFitInHeap could look something like this:
    uint32_t heapSize = 100000000;
    void* heap = malloc(heapSize);
    LowLevelAssert(heap != nullptr);
    cFirstFitInHeap firstFit(heap, heapSize);
    cRecordingAllocator allocator(&firstFit, heap);
    RunBenchmarkWithAllocator(allocator);
    free(heap);
Note that we've had to choose a heap size, and that's all the first fit allocator gets to work with. It won't page any more memory in. If this heapSize value is not large enough, and the benchmark runs out of memory, it's going to crash out with an assertion. (More on this later.)
Example output
Here's the start of a binary file generated by this class:
00000014 002dc6ac 00000244 002dc45c
0000005c 002dc3f4 00000064 002dc384
0000000c 002dc36c 00000008 002dc358
000000b4 002dc298 0000002c 002dc260
0000002c 002dc228 00000014 002dc208
0000006c 002dc190 00000144 002dc040
000000a4 002dbf90 000000c4 002dbec0
(So you can see two columns there, with size and block offset. Block offsets start from the end of the heap, because of the way cFirstFitInHeap is implemented. Later on there are some ffffffff size entries where the benchmark actually starts to free allocated blocks but I've cut this down to reduce page size.)
Playback time
Here's what we use to replay the script:
// ReplayAllocator.h

#pragma once
#include "iAllocator.h"

class cReplayAllocator : public iAllocator
{
    iAllocator* _base;
    char* _heapStart;
    void* _buffer;
    uint32_t* _bufferPos;
    uint32_t* _bufferEnd;

    uint32_t offsetFor(void* ptr) const;
    void checkU32(uint32_t v);
    uint32_t getU32();

public:

    // heap must stay valid
    // for lifetime of this object
    // but can be invalid on destructor call
    cReplayAllocator(void* heapStart);
    ~cReplayAllocator();

    void* allocate(uint32_t size);
    void deallocate(void* ptr);
};
// ReplayAllocator.cpp

#include "ReplayAllocator.h"
#include "LowLevelAssert.h"
#include <stdio.h>
#include <stdlib.h>
#include <string.h>

uint32_t
cReplayAllocator::offsetFor(void* ptr) const
{
    LowLevelAssert(ptr != nullptr);
    char* cptr = reinterpret_cast<char*>(ptr);
    LowLevelAssert(cptr >= _heapStart);
    return cptr - _heapStart;
}

void
cReplayAllocator::checkU32(uint32_t v)
{
    LowLevelAssert(_bufferPos != _bufferEnd);
    LowLevelAssert(*_bufferPos == v);
    ++_bufferPos;
}
uint32_t
cReplayAllocator::getU32()
{
    LowLevelAssert(_bufferPos != _bufferEnd);
    return *_bufferPos++;
}

cReplayAllocator::cReplayAllocator(
        void* heapStart
        )
{
    _heapStart = reinterpret_cast<char*>(heapStart);
    FILE *file = fopen("allocationScript.bin", "rb");
    LowLevelAssert(file != nullptr);
    int failed = fseek(file, 0, SEEK_END);
    LowLevelAssert(!failed);
    size_t len = ftell(file);
    failed = fseek(file, 0, SEEK_SET);
    LowLevelAssert(!failed);

    LowLevelAssert(len >= sizeof(uint32_t));
    LowLevelAssert(len % sizeof(uint32_t) == 0);
    _buffer = malloc(len);
    LowLevelAssert(_buffer);

    size_t numberRead = fread(_buffer, 1, len, file);
    LowLevelAssert(numberRead == len);

    _bufferPos = reinterpret_cast<uint32_t*>(_buffer);
    _bufferEnd = _bufferPos + (len / sizeof(uint32_t));
}
cReplayAllocator::~cReplayAllocator()
{
    free(_buffer);
}

void*
cReplayAllocator::allocate(uint32_t size)
{
    checkU32(size);
    return _heapStart + getU32();
}
void
cReplayAllocator::deallocate(void* ptr)
{
    if(ptr != nullptr)
    {
        checkU32(0xffffffff);
        checkU32(offsetFor(ptr));
    }
}
Note that a lot of this code is not actually necessary for just servicing allocation requests. We're effectively also checking that the sequence of calls to this allocator correspond to the sequence of calls originally made to cRecordAllocator.
It can be hard to guarantee absolutely deterministic code, and it's definitely a good idea to have a way to detect divergence short of crashes and 'undefined behaviour', but there's some overhead for this checking. We'll have a look at measuring how much this actually costs in practice, later on.
Note that LowLevelAssert() should be enabled in release mode, and we would like this to be pretty fast if possible.
Setup for replay iteration
Code to run the replay iteration of our benchmark (the one that actually gets timed) could look something like this:
    uint32_t heapSize = 100000000;
    void* heap = malloc(heapSize);
    LowLevelAssert(heap != nullptr);
    memset(heap, 0, heapSize);
    cReplayAllocator allocator(heap);
    RunBenchmarkWithAllocator(allocator);
    free(heap);
I've added a memset there based on Bruce Dawson's advice, to help avoid potential write triggered overhead (but I think we're insulated from these kinds of issues, to some extent, given that we only ever touch one single OS allocated block).
Assume timing is handled inside the benchmark.
Note that the heapSize value needs to match the value used when recording our allocation script. It would be slightly better, perhaps, to include this heap size in the allocation script, but the potential out of memory condition is more fundamental, I think, and something we'll need to handle anyway.
Out of memory condition
So hard coding a heap limit in your benchmark framework is not really ideal. How can we improve on this?
Maybe we could add some code for paging new blocks of memory in. And then I guess pages could get reinstated for replay and mapped to the original pages by some kind of page numbering setup. But I prefer to keep things simple.
The amount of memory used by each benchmark task is something that's worth keeping track of in itself, I think. So I suggest adding a kind of meta benchmark management layer that stores this information together with the rest of the benchmarking measures and statistics, and use the last known heap size requirement as a base line value. For maximum useability we should detect when benchmarks exceed this base line value, re-run with an increased limit, and report the various other benchmark measures as well as the fact that the benchmark exceeded the base-line memory limit.
No memory hooks?
I'm kind of lucky in that PathEngine is already set up with memory hooks and a mechanism for setting up custom allocators. If you don't have something like this already in place, you'll need to do a little bit more work.
The simplest thing to do in this case is probably to override global operator new and delete (which are 'replaceable') and feed these on through iAllocator (or something similar).
Be careful with changing the allocation setup at runtime, however. For example, I've seen cases in the past where the std library made allocations before the program start (in some code to do with locale handling) and then freed these blocks later on inside certain library calls.
The safest thing to do (if overriding global new and delete), is perhaps to compile a separate exe (or dll) for each instrumented run of your benchmark with the relevant memory instrumentation turned on permanently in each case.
Some results
With everything wired in correctly, let's see some results!
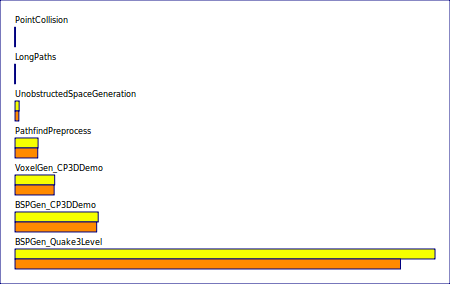
Some measurements from PathEngine, with vanilla benchmark timing in yellow, and allocation script replay in orange:
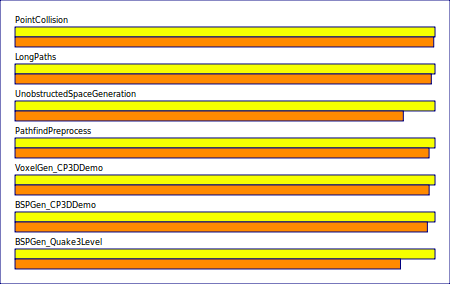
Actually we're not so interested in absolute times. The interesting thing is really just the difference between timings for each point, so here's the same set of points with measurements normalised:
The first two points benchmark run-time code (which should be avoiding dynamic allocation as far as possible). The next two points are preprocess generation, and the last three are mesh generation from 3D content.
It looks like there's still a bit of dynamic allocation going on in the run-time queries, in fact, but these measurements indicate that changing stuff to remove this is not likely to be worthwhile.
There's some significant overhead in unobstructed generation, however, and also in bsp generation on certain types of geometry, and these are things that could be worth targeting.
Recording cost
How long does it take to record allocation scripts?
Here are some measurements for recording times (with the first fit allocator), added in purple:
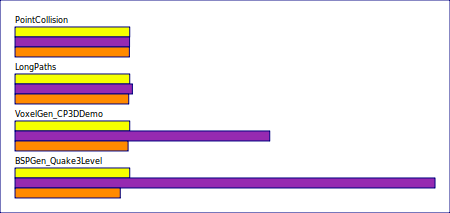
BSPGen_Quake3Level normally takes just under 3.5 seconds, but running this with first fit to record our allocation script takes this up to nearly 13 seconds.
The main cost here is our allocator implementation and so, if you have some heavyweight benchmarks, it can be worth optimising this a bit.
I've found that combining a fast fixed size allocator for all blocks below a certain minimum size, with first fit for blocks above that size, can help speed things up a lot.
It's actually pretty straightforward to extend the technique to parallel sub-allocators, in this way. If you assign each allocator to part of a single shared contiguous heap, no changes are required to the record and replay instrumentation. But watch out! When you start trying to write optimised memory allocator implementations, that's a dangerous rabbit hole you're looking at right there.
Checking the checking overhead
Remember that our ideal is to eliminate allocation overhead, and for this the allocation methods in cReplayAllocator should do as little work as possible.
But there are some assertions and checking code, and we touch more memory than is strictly required.
It's a good idea to try and measure how much all this checking is actually costing us, then, and for this we can do some timings with the checking stuff commented out.
In RecordingAllocator.cpp:
void*
cRecordingAllocator::allocate(uint32_t size)
{
    LowLevelAssert(size < 0xffffffff);
    //writeU32(size);
    void* result = _base->allocate(size);
    writeU32(offsetFor(result));
    return result;
}
void
cRecordingAllocator::deallocate(void* ptr)
{
    if(ptr != nullptr)
    {
        //writeU32(0xffffffff);
        //writeU32(offsetFor(ptr));
        _base->deallocate(ptr);
    }
}
In ReplayAllocator.cpp:
void*
cReplayAllocator::allocate(uint32_t size)
{
    //checkU32(size);
    return _heapStart + getU32();
}
void
cReplayAllocator::deallocate(void* ptr)
{
    if(ptr != nullptr)
    {
        //checkU32(0xffffffff);
        //checkU32(offsetFor(ptr));
    }
}
(Actually there's still one more assert, inside getU32(), but ok..)
As before, the yellow bar shows the vanilla benchmark timing and the orange bar the benchmark time when replaying an allocation script (with checking). The red bars have been added to show benchmark time when replaying an allocation script with checking commented out as above:
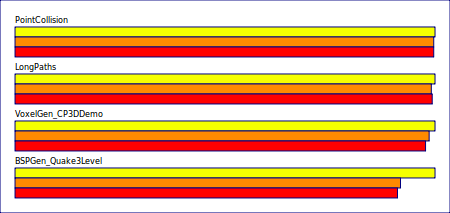
There's a bit of overhead for this checking, then, but not too much, and I'm basically happy enough leaving this checking in.
(This means that we'll underestimate the potential gain from removing dynamic allocation, in some situations, but fair enough. In many cases it won't be practical to completely eliminate allocations, and in cases where it is practical there will often be some other performance cost involved in our changes.)
Memory layout concerns, use a 'real' allocator?
One potential concern with the setup I've shown is that using a different allocation scheme (first fit, in this case) can change the way data tends to get laid out in memory, with potential knock-on effects on timings due to caching.
To make things really iron-clad with respect to this point (memory layout ) we could look at using a 'real' allocator (the Doug Lea allocator perhaps, or jemalloc), instead of cFirstFitInHeap, and tweaking this to force it to only allocate from one single contiguous page. Running the vanilla benchmark points with this tweaked allocator would then give base for comparison with exactly the same memory layout.
('Real' allocators add either a lot more lines to your code base, or another external dependency, however!)
Beyond simple time comparison
We can do a lot more with this, of course, besides simple comparison of high level benchmark timings. What we've got, essentially, is an additional measurement dimension that can be combined with a bunch of other existing benchmark measures.
So we can make comparisons in terms of processor event counts, profiler sample counts, and lower level timings. And then differential flame graphs are a great tool for hierarchical comparisons between vanilla and replay benchmark runs. With this set up properly, your profiler can basically point you directly to the actual code sections responsible for your allocation overhead.
Non-deterministic code
If your benchmarks can't be made to run deterministically (in the case of multithreaded benchmarks, for example) all is not completely lost, and there may still be ways to set things up with minimal allocation costs and make the same kinds of comparisons.
For example, you could just get hold of a big old chunk of memory, 'allocate' blocks by advancing a pointer through this 'heap', and just return with no action on calls to deallocate(). Don't forget to write to this block ahead of your benchmarking, in case of write triggered costs. You may need to cut down the scope of some benchmarks, and avoid stuff that does a lot of memory churn, in order to make this practical, but the result is then fairly similar and opens up the same kinds of comparison possibilities.
Or, even simpler, just stub out all calls to operator delete(), and see what this does to your benchmark timings..
Summary
- Dynamic memory allocation is complicated, and removing allocation can give significant speedups.
- But getting rid of allocation can have other costs, and can reduce code quality.
- Measurements based optimisation is good.
- If we can eliminate memory allocation overhead, we can measure this overhead (by comparison).
- We can effectively achieve this, in deterministic code, by recording and replaying allocation patterns.
- Similar but more approximate techniques are possible for non-deterministic code.
This is all really straightforward to implement.
If you have some C++ benchmarks, and you don't know how much time these spend in allocation, try setting this up today. (Let me know how you get on.)
It should be possible to apply the technique shown here, in other languages. If you do this, let me know!